Fort Worth Real Estate Market 2026: The Annual Report
Fort Worth’s median closed sale price ran $334,990 for 2024, $330,000 for 2025, and $327,500 in August 2026, per TRERC’s NTREIS MLS data for the Fort Worth local market area. Price has held nearly flat for three years. This year’s changes show up in how long a house sits and how often the price gets cut.
Every figure in this report carries a date, a geography, and a source. The Fort Worth sale-price and inventory figures come from the Texas Real Estate Research Center (TRERC) at Texas A&M, using NTREIS MLS closed-sale data for August 2026. The Tarrant County listing figures come from Realtor.com research data, and the DFW-metro and typical-value figures come from Zillow research data, both for July or August 2026 as labeled below. I refresh this page quarterly, and the section near the bottom names which numbers get replaced.
This is the year-level view of the market. For the snapshot in isolation, including the four indicator thresholds I track instead of forecasting, my current conditions page handles that, and the monthly DFW market report carries the underlying data as it lands.
The Three-Year Price Trajectory
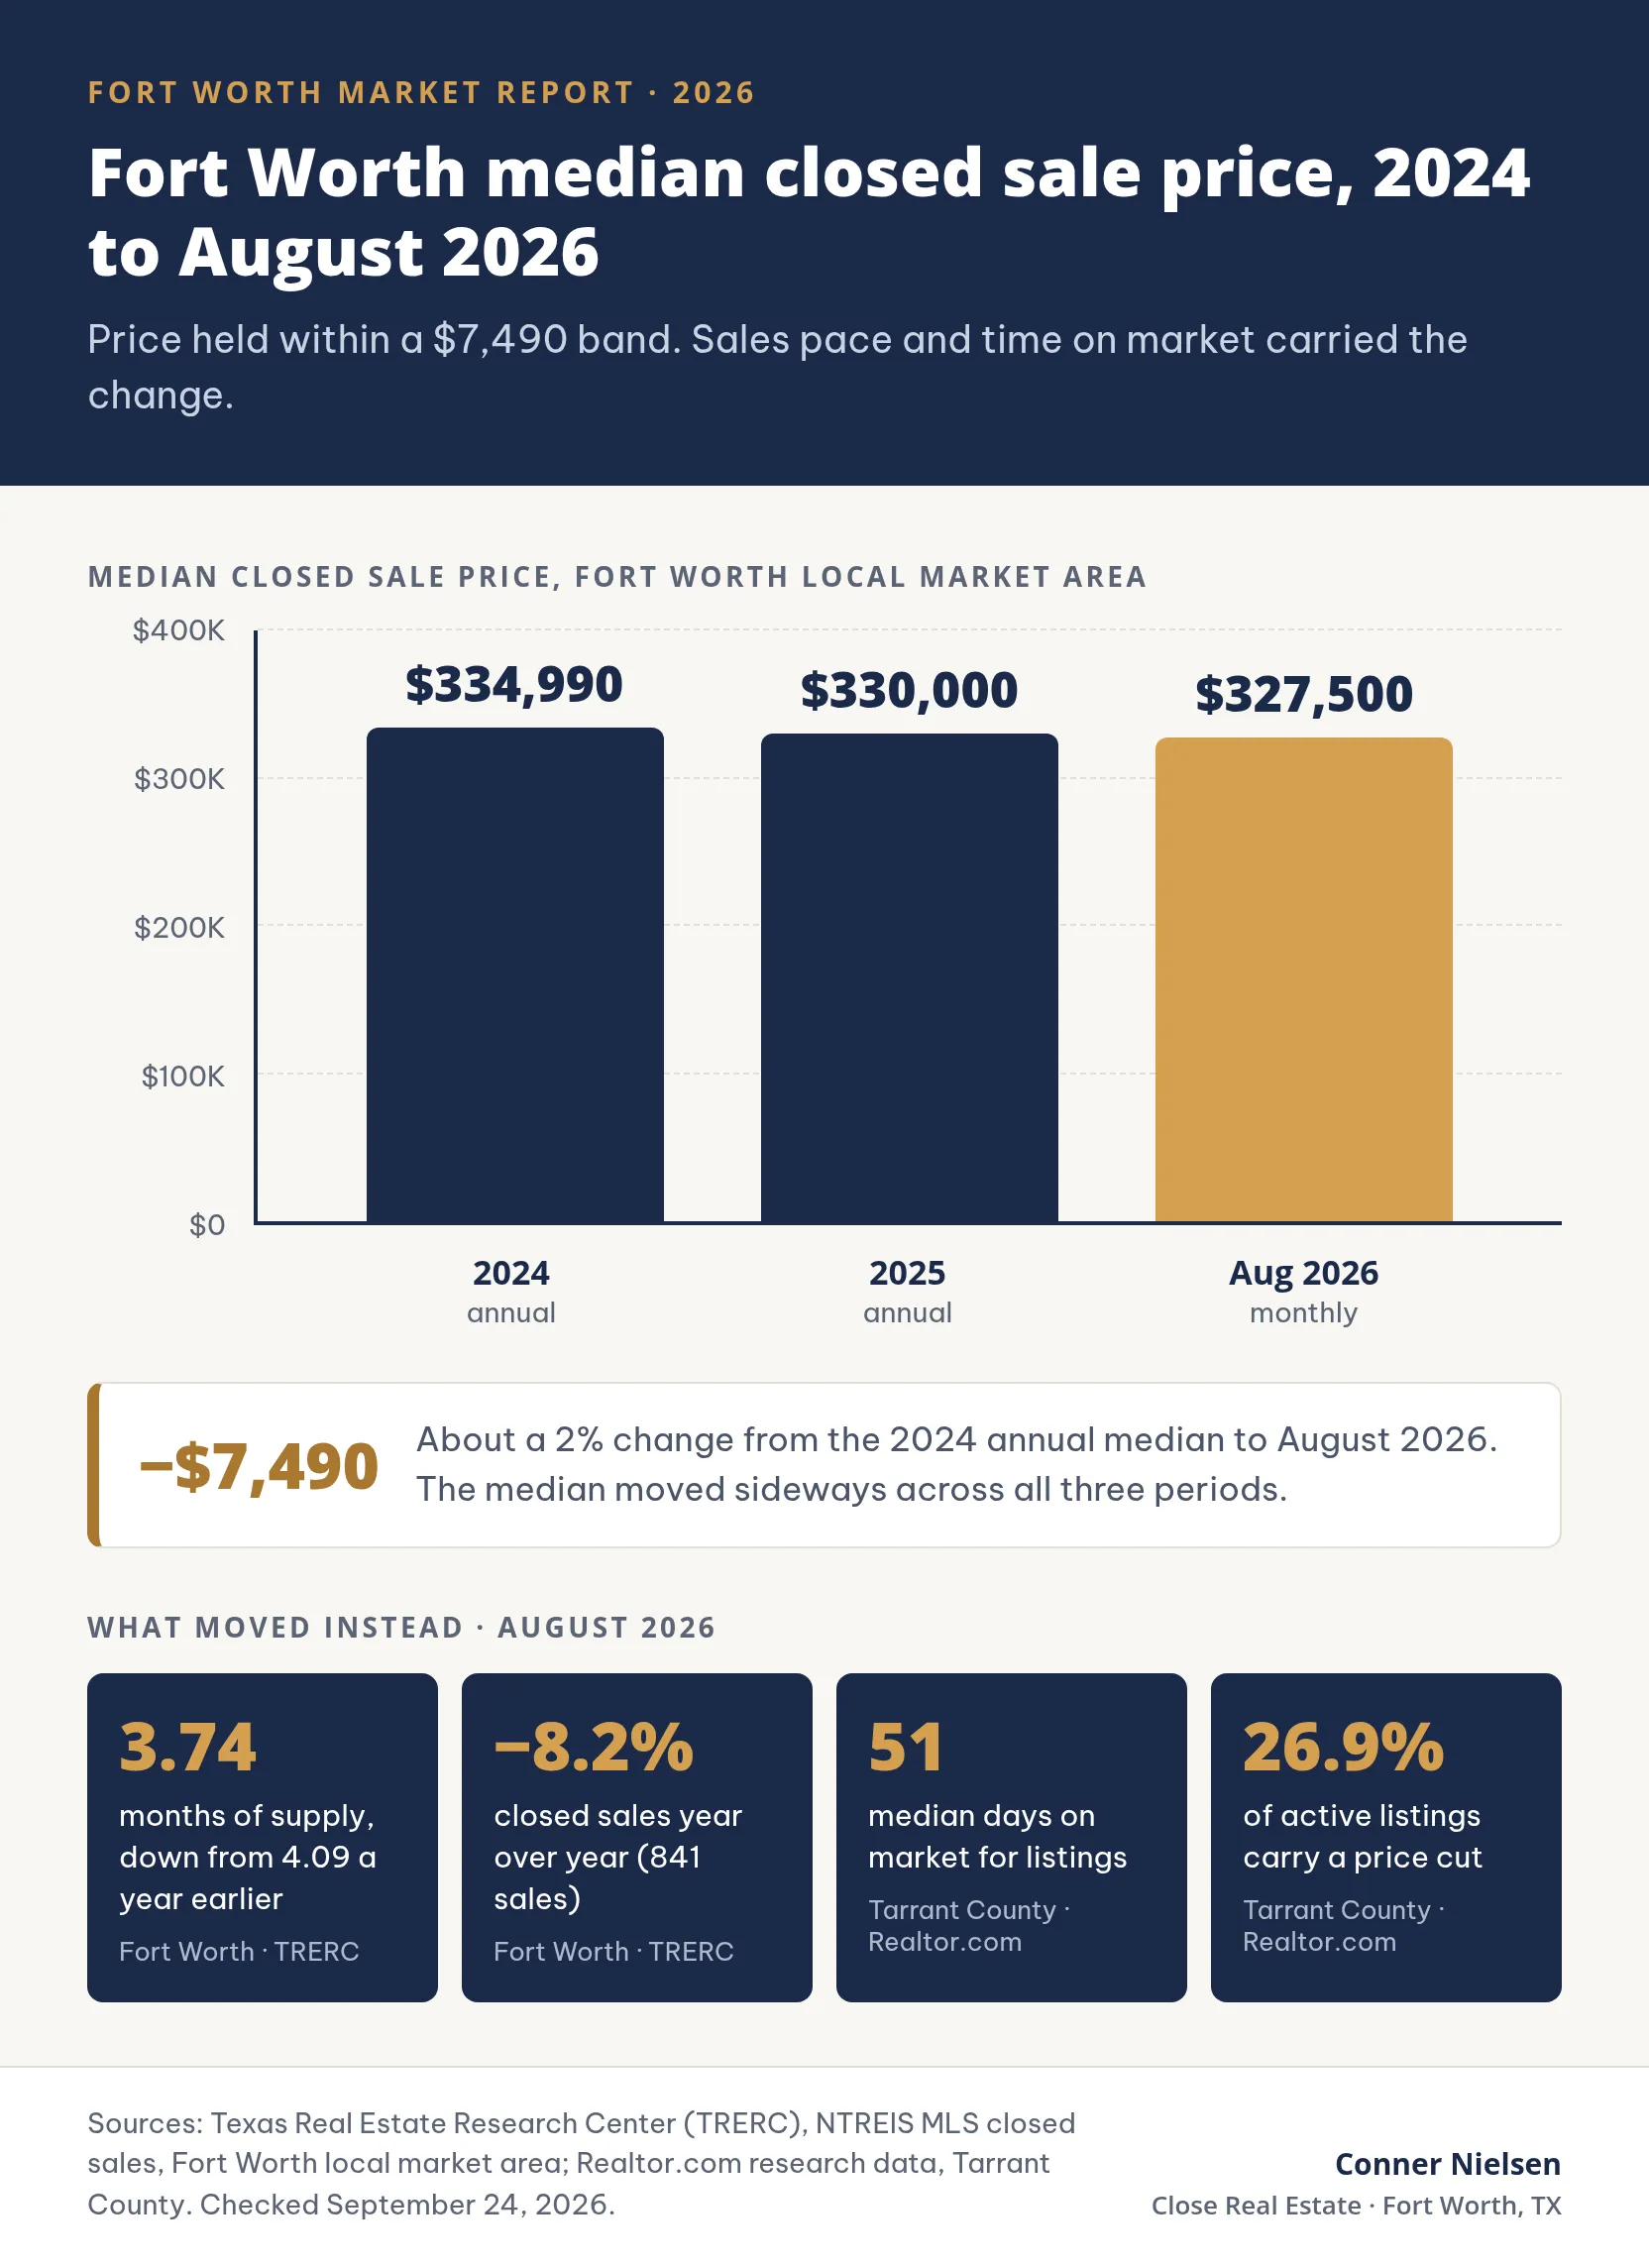
The change from the 2024 annual median to August 2026 is $7,490, or about 2%. That is a smaller shift than the headlines about a Texas correction would suggest.
Transaction volume moved more than price. Closed sales in August 2026 ran 8.2% behind August 2025, and Fort Worth’s months of supply fell from 4.09 to 3.74 over the same year, per TRERC. Fewer homes changed hands, and the homes still on the market represent a slightly smaller multiple of the current sales pace than they did a year ago.
Months of supply measures Fort Worth’s closed-sale pace. It does not say how long a listing sits before it gets an offer. Tarrant County’s listing data covers that part of the story: a median 51 days on market and 26.9% of active listings carrying a price cut, both per Realtor.com’s August 2026 data.
Where the Market Sits in 2026
The figures below draw on three primary sources, each labeled for its own geography. The Fort Worth sale-price and inventory figures are TRERC’s Fort Worth housing activity data from the NTREIS MLS for August 2026. The Tarrant County listing figures are Realtor.com research data, also for August 2026. The average sale-to-list and days-to-pending figures are Zillow research data for the DFW metro, the only level at which those two measures are published.
| Indicator | Value | Year over year | Geography · Source |
|---|---|---|---|
| Median closed sale price | $327,500 | down 0.76% vs. 2025 annual median | Fort Worth · TRERC/NTREIS MLS, Aug 2026 |
| Months of supply | 3.74 | down from 4.09 | Fort Worth · TRERC/NTREIS MLS, Aug 2026 |
| Closed sales | 841 | down 8.2% | Fort Worth · TRERC/NTREIS MLS, Aug 2026 |
| Active listings | 5,928 | down 7.3% | Tarrant County · Realtor.com, Aug 2026 |
| New listings | 2,336 | n/a | Tarrant County · Realtor.com, Aug 2026 |
| Median days on market (listing) | 51 | n/a | Tarrant County · Realtor.com, Aug 2026 |
| Listings with a price cut | 26.9% | n/a | Tarrant County · Realtor.com, Aug 2026 |
| Average sale-to-list ratio | 98.1% | n/a | DFW metro · Zillow, Jul 2026 |
| Share sold above list | 19.3% | n/a | DFW metro · Zillow, Jul 2026 |
| Average days to pending | 61 | n/a | DFW metro · Zillow, Aug 2026 |
In the city of Fort Worth, the pace of sales and the standing inventory pulled back together: closed sales fell 8.2% year over year and months of supply fell from 4.09 to 3.74. In Tarrant County, active listings fell 7.3% year over year, the median listing sits 51 days on market, and 26.9% of listings carry a price cut.
At 3.74 months of supply, Fort Worth still sits below the level most analysts treat as balanced, which points toward sellers. The Tarrant County listing data points the other way, with a 51-day median time on market and 26.9% of listings carrying a price cut. That split is why analysts disagree on whether it is a buyer’s or a seller’s market. I cover both readings on my market label page.
What Changed This Year, and What It Means For You
The 2026 movement shows up in pace and terms more than in price. Fort Worth’s median closed sale price has moved about 2% since 2024, while closed sales fell 8.2% year over year in August 2026 and months of supply fell from 4.09 to 3.74, per TRERC’s NTREIS MLS data. County and metro data show the same pattern. Tarrant County listings sit a median 51 days before going under contract and 26.9% carry a price cut, per Realtor.com’s August 2026 data, and DFW-metro homes take an average of 61 days to reach pending status, per Zillow.
Buying in 2026
Fort Worth’s median closed sale price sits about 2% below where it was in 2024, and the 30-year mortgage rate remains elevated at 6.95%, per Freddie Mac’s survey for the week of September 17, 2026, so affordability is about where it was. Buyers have more leverage. Repair credits, closing-cost concessions, and seller-paid rate buydowns are live negotiating items again across Tarrant County, where the median listing sits 51 days before going under contract, per Realtor.com’s August 2026 data.
Prepared, correctly priced homes still draw competition. Zillow’s DFW-metro data for July 2026 shows 19.3% of homes still closing above list. In my own transactions those are mostly move-in-ready homes priced at or below the local comps, so the strategy is to bring your strongest terms there and negotiate everywhere else. Total buyer costs are the number to build a budget around rather than the sale price alone, and my buyer representation covers what I pay for on your side.
Selling in 2026
An average DFW-metro sale-to-list ratio of 98.1% and a Tarrant County median of 51 days on market set the terms for every listing this year, per Zillow’s July 2026 data and Realtor.com’s August 2026 data. A home that is prepped and priced against actual comparable sales still finds a buyer close to that timeline. A home that launches above the comps and gets repriced in public is what pushes the sale-to-list ratio down and adds to the 26.9% of Tarrant County listings carrying a price cut, per Realtor.com.
Home condition affects the sale more now than it did in 2024. A pre-listing inspection shows you the defects before the buyer’s inspector finds them, so you can repair them or price them in first. My listing agent service covers that inspection at roughly $600 along with cleaning, repairs, and staging, and my seller services page walks through the full sequence.
Why the Published Medians Disagree
Texas is a non-disclosure state. Sale prices are not recorded in a public document, which means no single source captures a complete record of what homes actually traded for. The Tarrant Appraisal District values property without that record, and every research source that does publish a number is measuring something different: an MLS-reported closed sale, a modeled home value, or a price a seller is asking rather than one a buyer paid.
Three primary sources checked on September 24, 2026 show the gap.
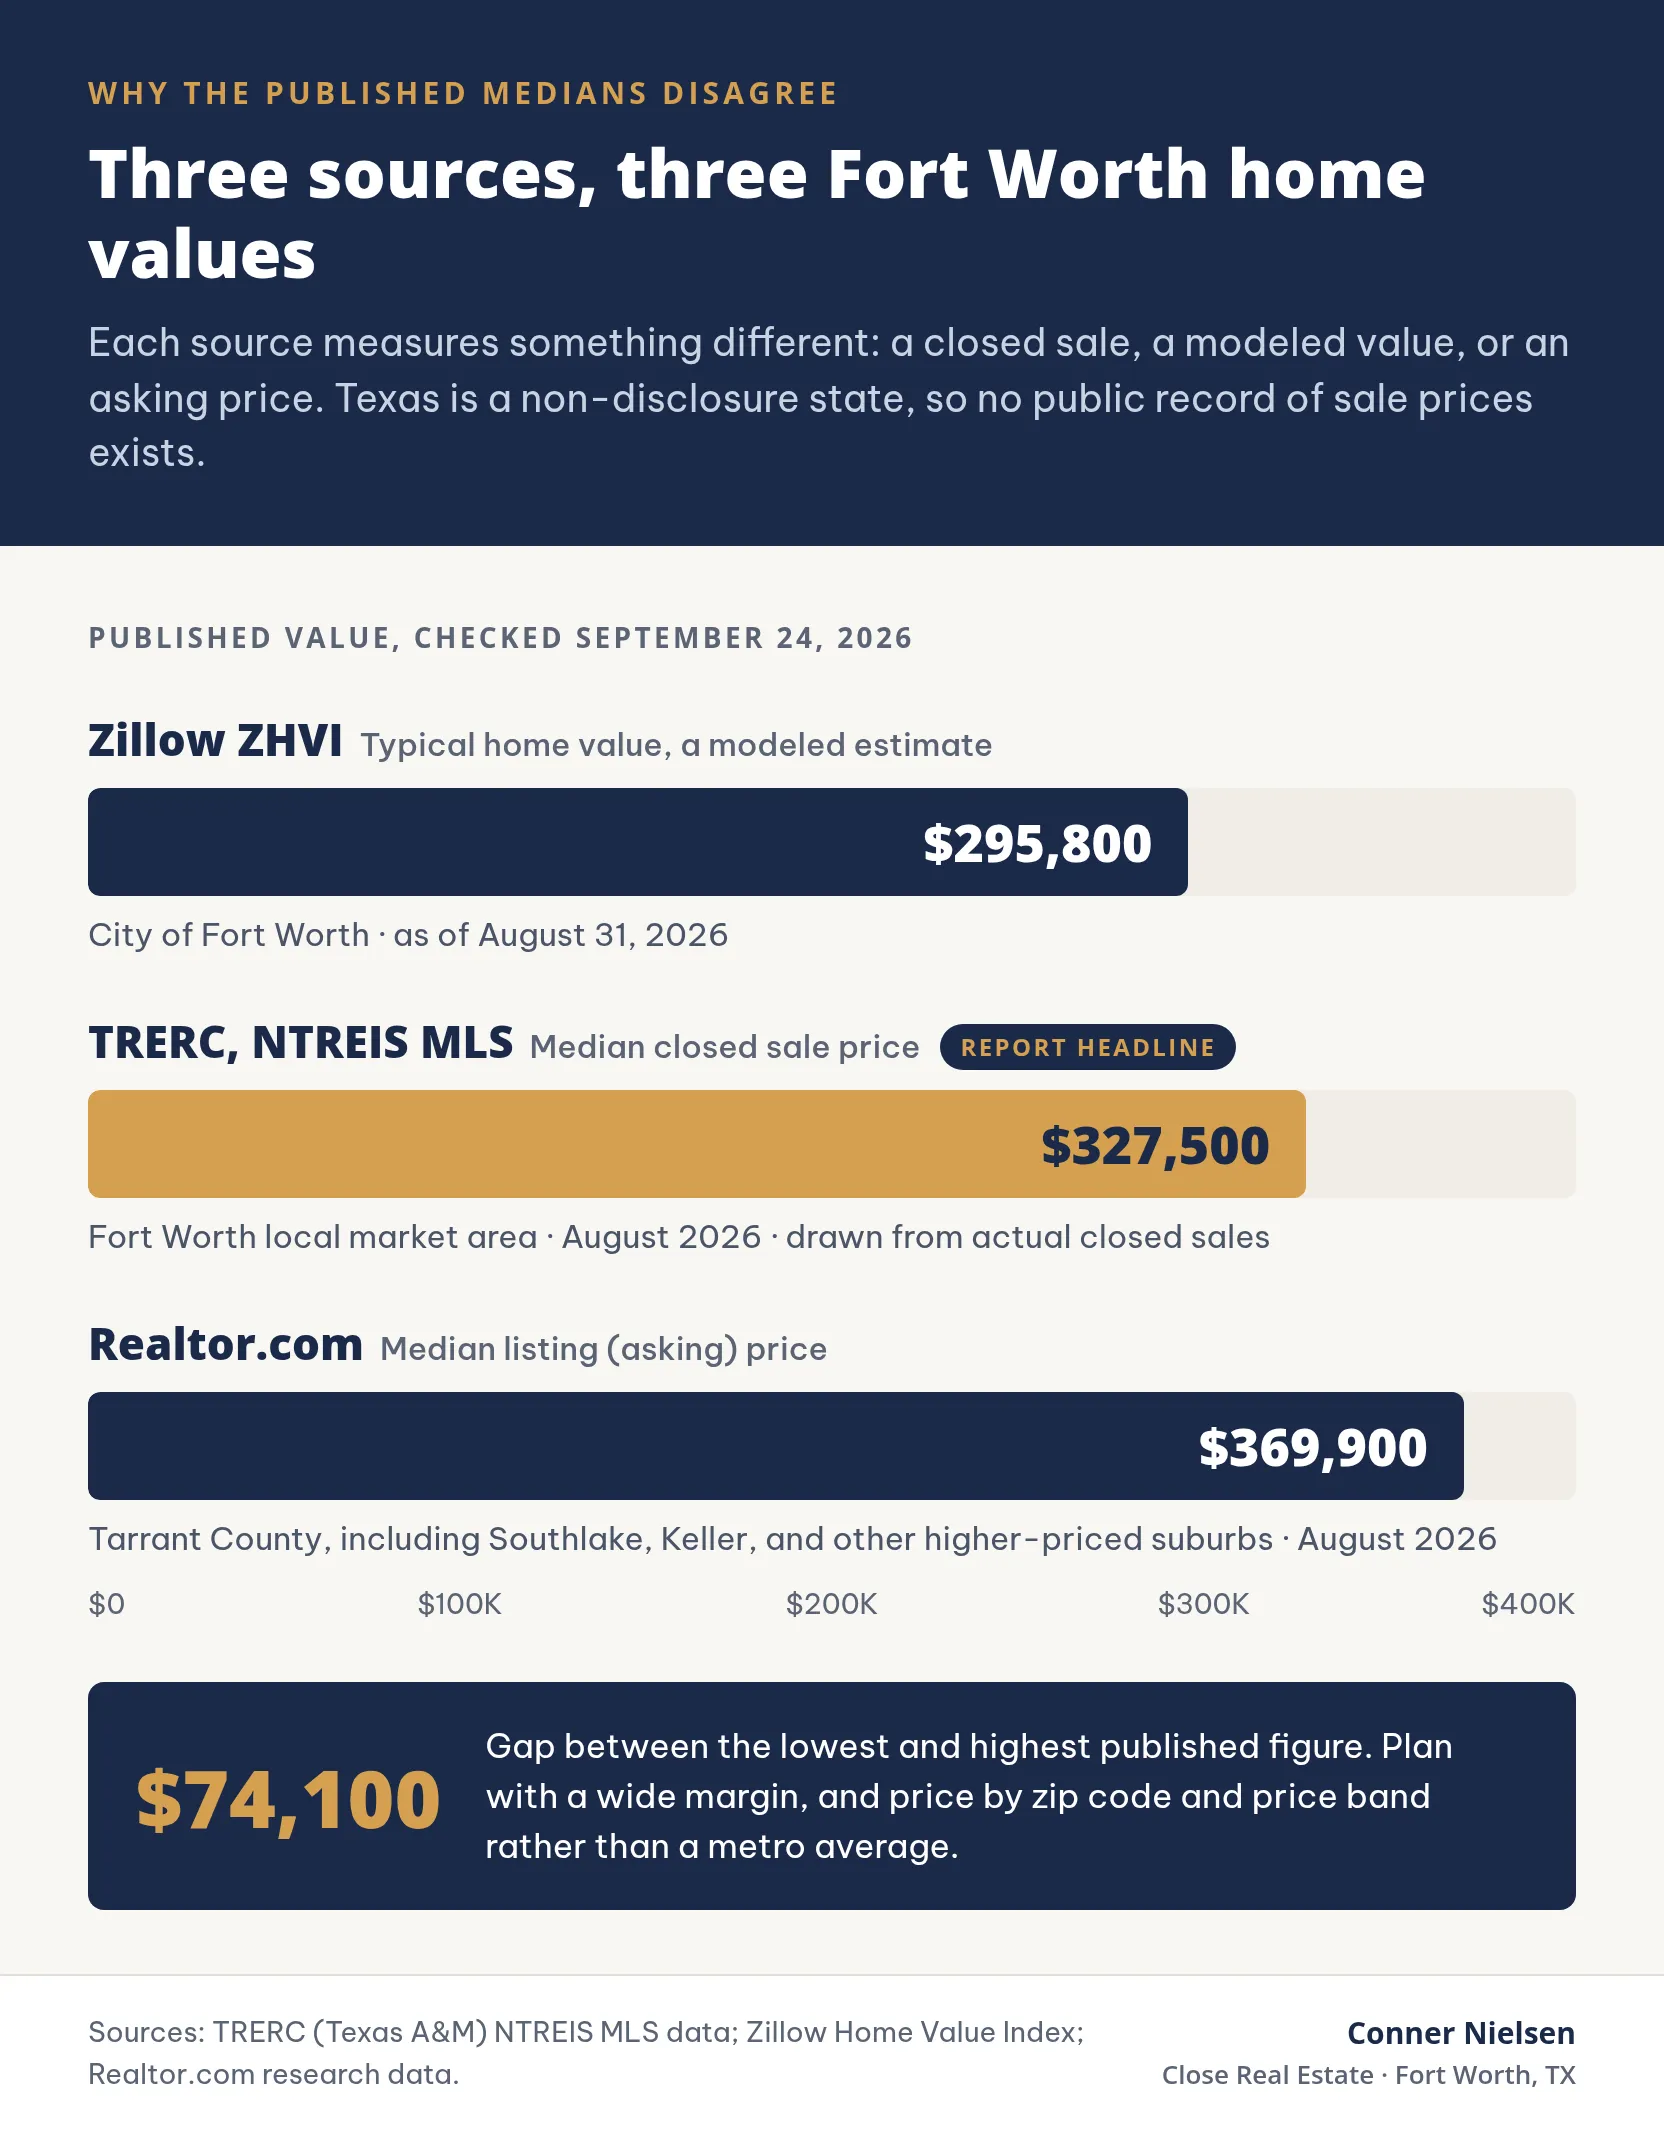
Each source measures something different. TRERC’s figure comes from closed transactions reported to the NTREIS MLS. Zillow’s figure is a statistical model of what a typical home in Fort Worth is worth. Realtor.com’s figure is the asking price across Tarrant County, which includes more expensive suburbs than the city of Fort Worth.
A fourth measure, the FHFA house price index, tracks repeat sales of the same homes over time and is published at the metro level. It shows the direction of prices rather than a Fort Worth sale price, so I left it out of the chart.
I publish the TRERC figure as this report’s headline number because it is drawn from closed sales, and I label the other two for what they measure. With a $74,100 gap between the low and high figures, plan with a wide margin around any market average. I run the numbers for a specific zip code and price band before advising anyone on timing.
The terms you can negotiate are set by the promulgated contract forms published by the Texas Real Estate Commission. Market conditions decide how much of those forms a seller will agree to leave intact.
The Forecast Through 2027, With Its Limits
I will not publish a percentage for 2027, because no honest model produces one for a single city at this resolution. The outlook below is directional and conditional.
The most defensible expectation is a continuation of the current plateau: a median that moves within a narrow band while sales pace and time on market carry most of the year-to-year change. Dallas-Fort Worth keeps adding households and jobs, and a metro adding households does not typically produce a price collapse. The Federal Reserve Bank of Dallas tracks the metro’s payroll employment and unemployment rate each month in its DFW economic indicators.
Three things would change that direction:
The 30-year mortgage rate. The rate sets the monthly payment, which drives buyer demand. Freddie Mac’s survey put the 30-year rate at 6.95% for the week of September 17, 2026. If rates fell meaningfully, the negotiating room described above would close before prices moved, and the 19.3% share of DFW-metro homes selling above list would likely rise.
Tarrant County listings turning higher. Active listings there are down 7.3% year over year, per Realtor.com’s August 2026 data. If that reversed and new supply accelerated, the current balance between buyers and sellers would shift toward buyers faster than it has this year.
Fort Worth’s months of supply breaking its range. TRERC’s Fort Worth figure sits at 3.74 months as of August 2026, down from 4.09 a year earlier. A move above 4.5 would mean the market was loosening. A drop below 3 would mean it was tightening again.
Anyone quoting you a 2027 percentage for Fort Worth is estimating. The indicators above are observable monthly, which makes them more useful than a forecast, and the written guarantees I sign are structured around the same logic. I cover the transaction risk, which I can control. The market risk stays with you because no agent can remove it.
How This Page Gets Updated
This is an annual reference that gets a quarterly refresh, and I state the schedule so you can judge how fresh the numbers are when you read them.
Cadence: quarterly. Published September 24, 2026.
What gets replaced at each refresh:
- The Fort Worth figures from TRERC’s NTREIS MLS data: median closed sale price, closed sales, and months of supply. The as-of month moves with them.
- The Tarrant County figures from Realtor.com: active listings, new listings, median days on market, and the share of listings with a price cut.
- The DFW-metro figures from Zillow: average sale-to-list ratio, share sold above list, average days to pending, and Fort Worth’s typical home value.
- The source-comparison chart, re-checked against the same three publishers so the comparison stays like for like.
- The forecast section, rewritten against whatever the indicators did in the quarter.
What stays fixed: the 2024 and 2025 annual medians. Those are closed years and they do not get revised here.
Get Your Price Band, Not the Headline
Every number in this report is a metro average, and you are buying or selling one house in a specific price band and zip code. A $300,000 house in 76116 and a $650,000 house in Keller are in the same report and in completely different markets.
Book a free 10-minute Initial Consultation and I will pull the same data for your address and your band, tell you where the leverage actually sits in your segment, and give you a straight answer on whether the timing works. If that consultation wastes your time, I send you $100 by Venmo or Zelle.
If you would rather check on me before we talk, ask for my past client list. They publish their phone numbers, and you are welcome to call them first.
Frequently Asked Questions
Is Fort Worth a good place to buy a house in 2026?
Yes, for a buyer who is ready, because negotiating terms have improved while price has held. Fort Worth's median closed sale price sits at $327,500 as of August 2026, per TRERC's NTREIS MLS data, down 0.76% from the 2025 annual median of $330,000. Tarrant County listings sit a median 51 days before going under contract and 26.9% carry a price cut, per Realtor.com's August 2026 data, so repair credits, closing-cost help, and full option periods are back on the table across most of the market.
Are home prices dropping in Fort Worth?
Prices have dropped slightly. Fort Worth's median closed sale price moved from $334,990 in 2024 to $330,000 in 2025 to $327,500 in August 2026, per TRERC's NTREIS MLS data for the Fort Worth local market area, a three-year change of about 2%. Time on market and terms have shifted more: Realtor.com's August 2026 data shows a 51-day median time on market and 26.9% of Tarrant County listings carrying a price cut.
What is the median home price in Fort Worth?
$327,500 for closed sales in August 2026, per TRERC's NTREIS MLS data for the Fort Worth local market area, the figure this article uses throughout. Zillow and Realtor.com publish two other measures. Zillow's typical home value for Fort Worth is $295,800, a modeled estimate rather than a sale price. Realtor.com's median listing price for Tarrant County, a wider area that includes higher-priced suburbs, is $369,900. Texas is a non-disclosure state, so the method and the geography both matter, and a spread this wide is normal across measures that are not counting the same thing.
Is it a good time to sell a house in Fort Worth?
It depends on preparation and pricing more than it used to. A move-in-ready home priced against actual comparable sales still finds a buyer, but Fort Worth's closed sales fell 8.2% year over year in August 2026 and Tarrant County's median time on market reached 51 days, per TRERC and Realtor.com. An unprepared or aspirationally priced home carries a real penalty in a market moving at this pace. I pay for the pre-listing prep for my sellers so that decision does not compete with the moving budget.
Will Fort Worth home prices go up in 2027?
I will not give you a percentage for 2027, because no honest model produces one for a single city at this resolution. Directionally, a metro that keeps adding households and jobs does not usually produce a price collapse, so a continued plateau is the most defensible expectation the data supports. The variable that would change that direction is the 30-year mortgage rate, at 6.95% for the week of September 17, 2026, per Freddie Mac's weekly survey. If rates fell meaningfully, the negotiating room described in this report would close before prices moved. If Tarrant County's active listings, down 7.3% year over year per Realtor.com's August 2026 data, started growing again, supply would loosen faster than it has this year.
How often is this market report updated?
The report is updated quarterly. The How This Page Gets Updated section above names exactly which figures get replaced at each refresh: the TRERC figures for Fort Worth, the Realtor.com and Zillow figures for Tarrant County and the DFW metro, and the source-comparison chart. The 2024 and 2025 annual medians stay fixed because they are closed years.
Related Articles
Is Fort Worth a Buyer's or Seller's Market in 2026?
Fort Worth sits at 3.7 months of housing supply, which still leans seller. The negotiation numbers now agree more than they disagree. Both readings, explained.